OK.Wahl
Internetpräsentation
Version 2.2.7
Ergebnis zur Landtagswahl 2013 am 15.09.2013
Stimmkreis Ansbach Süd, Weißenburg - Gunzenhausen - Landkreis Weißenburg - Gunzenhausen - Markt Heidenheim
Es wurden alle Stimmbezirke ausgewertet.
 Diagramm
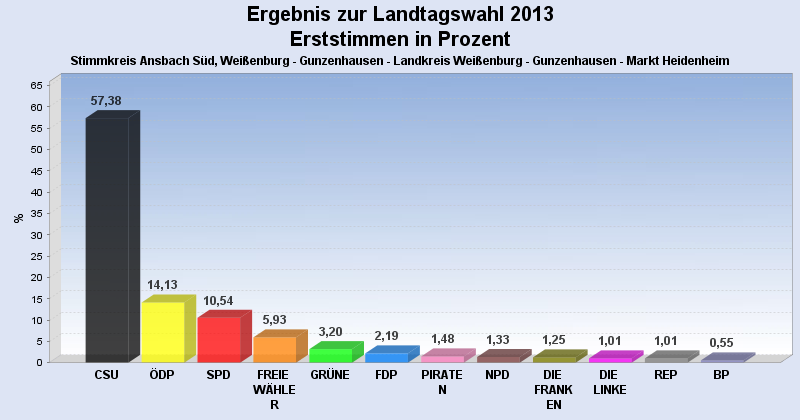
 Seitenanfang
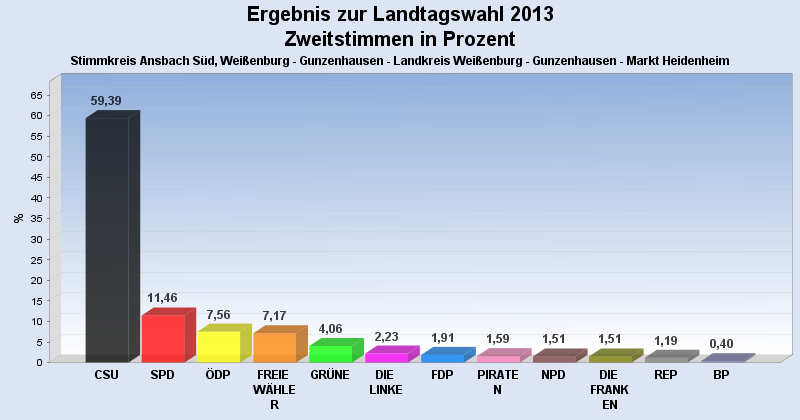
Wahlbeteiligung, Stimmzettel, Stimmen
| Wahlbeteiligung: | 64,74% |
|---|---|
| Stimmberechtigte: | 2.005 |
| Wähler: | 1.298 |
| Ungültige Erststimmen: | 16 |
| Gültige Erststimmen: | 1.281 |
| Ungültige Zweitstimmen: | 42 |
| Gültige Zweitstimmen: | 1.256 |
Erststimmen nach Wahlvorschlag
| Partei | Erststimmen | Prozent | |
|---|---|---|---|
| 1 | Westphal, Manuel ( CSU ) | 735 | 57,38% |
| 7 | Ebert, Reinhard ( ÖDP ) | 181 | 14,13% |
| 2 | Dösel, Harald ( SPD ) | 135 | 10,54% |
| 3 | Hauber, Wolfgang ( FREIE WÄHLER ) | 76 | 5,93% |
| 4 | Sauer, Dirk ( GRÜNE ) | 41 | 3,20% |
| 5 | Horrolt, Pierre ( FDP ) | 28 | 2,19% |
| 12 | Dr. Dietert, Tilko ( PIRATEN ) | 19 | 1,48% |
| 9 | Heiß, Michael ( NPD ) | 17 | 1,33% |
| 11 | Bosch-Armbrüster, Hedwig ( DIE FRANKEN ) | 16 | 1,25% |
| 6 | Pfahler, Sebastian ( DIE LINKE ) | 13 | 1,01% |
| 8 | Krauthansl, Peter ( REP ) | 13 | 1,01% |
| 10 | Henck-Wagler, Inge ( BP ) | 7 | 0,55% |
Zweitstimmen nach Wahlvorschlag
| Partei | Zweitstimmen | Prozent | |
|---|---|---|---|
| 1 | CSU | 746 | 59,39% |
| 2 | SPD | 144 | 11,46% |
| 7 | ÖDP | 95 | 7,56% |
| 3 | FREIE WÄHLER | 90 | 7,17% |
| 4 | GRÜNE | 51 | 4,06% |
| 6 | DIE LINKE | 28 | 2,23% |
| 5 | FDP | 24 | 1,91% |
| 12 | PIRATEN | 20 | 1,59% |
| 9 | NPD | 19 | 1,51% |
| 11 | DIE FRANKEN | 19 | 1,51% |
| 8 | REP | 15 | 1,19% |
| 10 | BP | 5 | 0,40% |
- Stand: 19.09.2013 11:28:01