OK.Wahl
Internetpräsentation
Version 2.2.7
Ergebnis zur Landtagswahl 2013 am 15.09.2013
Stimmkreis Ansbach Süd, Weißenburg - Gunzenhausen - Landkreis Weißenburg - Gunzenhausen - Stadt Gunzenhausen
Es wurden alle Stimmbezirke ausgewertet.
 Diagramm
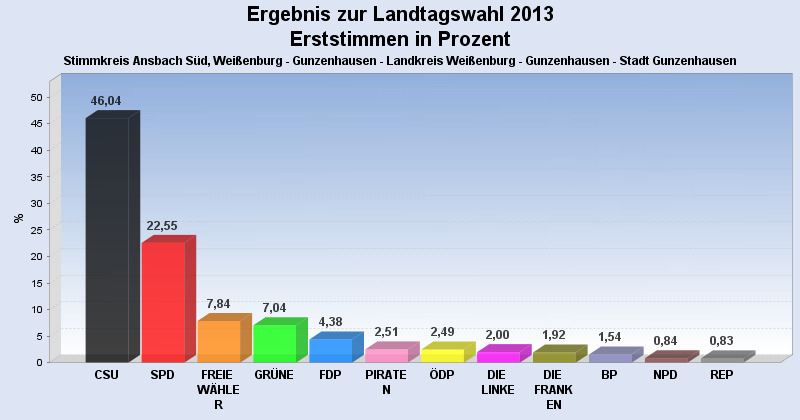
 Seitenanfang
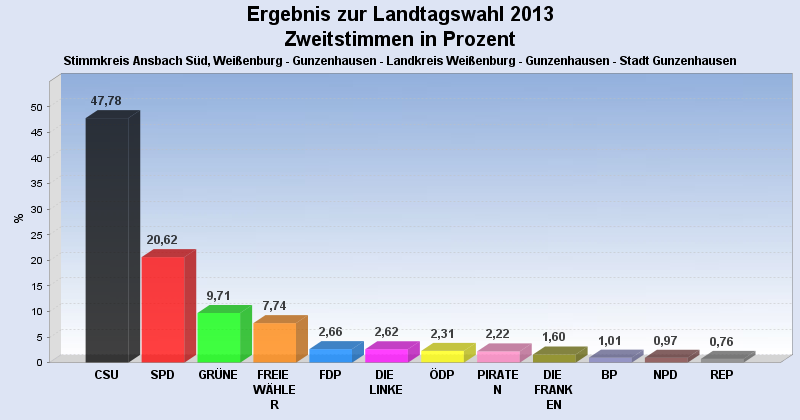
Wahlbeteiligung, Stimmzettel, Stimmen
| Wahlbeteiligung: | 58,59% |
|---|---|
| Stimmberechtigte: | 12.811 |
| Wähler: | 7.506 |
| Ungültige Erststimmen: | 124 |
| Gültige Erststimmen: | 7.382 |
| Ungültige Zweitstimmen: | 150 |
| Gültige Zweitstimmen: | 7.356 |
Erststimmen nach Wahlvorschlag
| Partei | Erststimmen | Prozent | |
|---|---|---|---|
| 1 | Westphal, Manuel ( CSU ) | 3.399 | 46,04% |
| 2 | Dösel, Harald ( SPD ) | 1.665 | 22,55% |
| 3 | Hauber, Wolfgang ( FREIE WÄHLER ) | 579 | 7,84% |
| 4 | Sauer, Dirk ( GRÜNE ) | 520 | 7,04% |
| 5 | Horrolt, Pierre ( FDP ) | 323 | 4,38% |
| 12 | Dr. Dietert, Tilko ( PIRATEN ) | 185 | 2,51% |
| 7 | Ebert, Reinhard ( ÖDP ) | 184 | 2,49% |
| 6 | Pfahler, Sebastian ( DIE LINKE ) | 148 | 2,00% |
| 11 | Bosch-Armbrüster, Hedwig ( DIE FRANKEN ) | 142 | 1,92% |
| 10 | Henck-Wagler, Inge ( BP ) | 114 | 1,54% |
| 9 | Heiß, Michael ( NPD ) | 62 | 0,84% |
| 8 | Krauthansl, Peter ( REP ) | 61 | 0,83% |
Zweitstimmen nach Wahlvorschlag
| Partei | Zweitstimmen | Prozent | |
|---|---|---|---|
| 1 | CSU | 3.515 | 47,78% |
| 2 | SPD | 1.517 | 20,62% |
| 4 | GRÜNE | 714 | 9,71% |
| 3 | FREIE WÄHLER | 569 | 7,74% |
| 5 | FDP | 196 | 2,66% |
| 6 | DIE LINKE | 193 | 2,62% |
| 7 | ÖDP | 170 | 2,31% |
| 12 | PIRATEN | 163 | 2,22% |
| 11 | DIE FRANKEN | 118 | 1,60% |
| 10 | BP | 74 | 1,01% |
| 9 | NPD | 71 | 0,97% |
| 8 | REP | 56 | 0,76% |
- Stand: 19.09.2013 11:27:31